Case study · Software

BD Inventory Optimization Analytics

A medication shortage management module designed for BD’s HealthSight Analytics platform, under a contract engagement covering the module end to end. It gives hospital pharmacy managers a single view of how long a short drug will last, where the remaining doses sit across the facility, what has already been done about it, and what can be substituted. Delivered as a fully interactive Axure RP prototype with conditional logic and persistent state, so scenarios could be tested against it like working software.

The problem

A medication shortage is not an inventory problem. It is a time problem with an inventory shape.

The drug is short nationally. Your facility has some doses, but they are scattered across dispensing cabinets, carts and the central pharmacy, and the system counts them as one number. You need to know how many days you actually have, where the doses physically are, what you can substitute, who has already been called, and what was agreed — and you need it before the next shift starts.

What existed instead was a stock number and a reorder date. Everything else — the location hunt, the phone calls, the substitution decision, the record of what happened — lived in spreadsheets, email and somebody’s memory.

The hard part was never showing the shortage. It was showing it alongside everything a person needs to act on it, without turning the screen into a wall.
5 views
one lifecycle: recommend, queue, confirm, ignore, escalate
3 answers
how long, where, and what instead — on one screen
Axure RP
a working prototype, not a picture of one
Contract
one-off engagement, module design end to end

The walkthrough

Two minutes through the working prototype. Every control responds, every state changes — this is the prototype behaving, not a video of mockups.

WalkthroughThe recommendations queue, the change lifecycle, and the shortage detail view — recorded from the live prototype.

Or open the prototype yourself and click through it. Password demofinal. It is a decade old and it still runs.

The design decisions

Four, and they are all about compressing a decision rather than displaying data.

One

Days, not units

The number a person can act on.

  • The unit of urgency is time. A count of doses means nothing without consumption. The primary figure throughout is days on hand, calculated against actual daily usage and its peak — because “forty-one doses” and “two days” produce completely different behaviour from the same person.
  • Two dates, side by side. Projected stock-out and expected restock sit next to each other. The gap between them is the entire problem, and putting them together means nobody has to work it out.
  • Priority is explicit. A simple ranking across shortage items, so a manager with seventeen open shortages knows which three matter this morning.
Two

Where the doses actually are

One number hides the useful answer.

  • Break the total apart. A facility total is a reporting number. The actionable version is the distribution — which cabinets, which carts, which pharmacy, how many in each, and how long each location lasts at its own usage rate.
  • Act at the location. Accept or de-stock per location, or in bulk across all of them, directly from the breakdown. The decision and the action live in the same place, so redistributing stock does not mean a second system.
Three

The case history

The part that was not in the brief.

  • A shortage is a conversation. Calls to other facilities, counts verified, boxes borrowed, manufacturer delays confirmed. That narrative was the real coordination layer and it lived nowhere — so the detail view carries a timestamped, attributed log of what happened and who did it.
  • Why it matters more than the chart. It means the person arriving on the next shift inherits the situation rather than restarting it. In a multi-day shortage across several facilities, that is the difference between managing it and rediscovering it.
Four

Substitutes in the same view

The answer next to the problem.

  • Do not make them leave. Substitution search sits inside the shortage detail, keyed on description, medication ID or national drug code. The moment somebody concludes “we will not make it,” the alternative is already on screen rather than three systems away.
  • Exportable, because of what happens next. Print, email and export on the panel itself — shortages get escalated to people who are not in the tool, and a decision support screen that cannot leave the screen gets copied into an email by hand.

The shortage sits inside a lifecycle

The module was not a standalone alert screen. It is the exception path through an existing optimisation workflow, which is what made it adoptable.
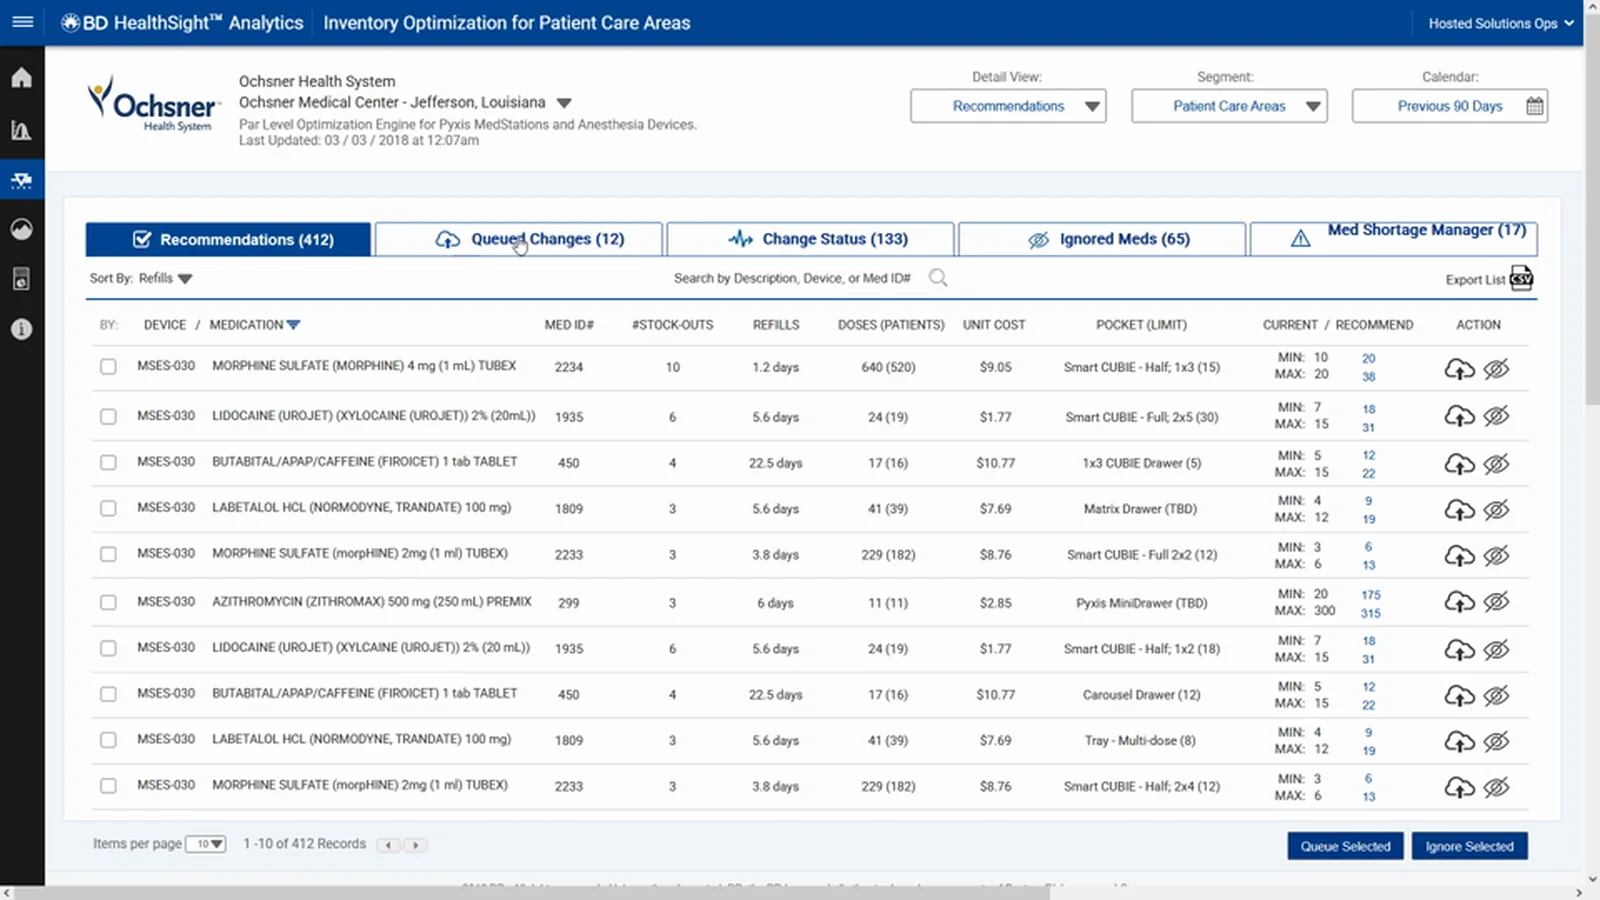
Inventory recommendations table: medications listed with restock days, doses, unit cost, current and recommended minimum and maximum levels, with bulk queue and ignore actions.
LifecycleRecommendations, queued changes, change status and ignored items — a system suggests par-level changes, a human accepts or defers them, and the record shows what actually went through. The shortage manager is the fifth tab: the path for when the normal cycle will not resolve it in time.
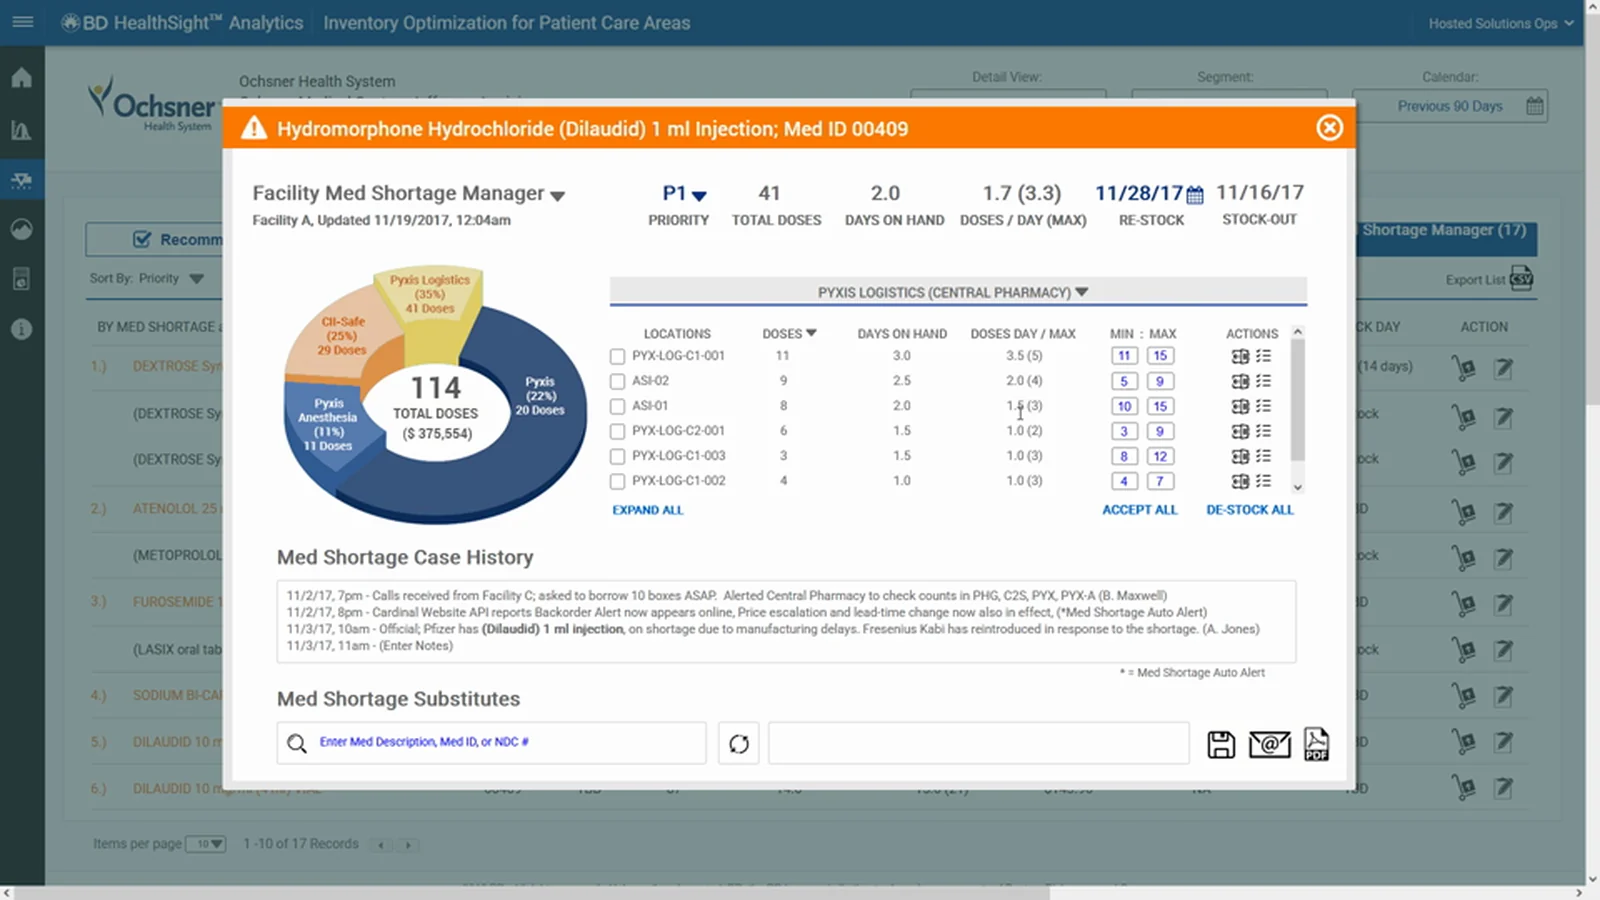
Shortage detail panel: priority and days-on-hand metrics, a donut chart of total doses by location, a per-location table with accept and de-stock actions, a timestamped case history, and a substitutes search.
DetailThe shortage view. Urgency across the top, physical distribution in the middle, the human record underneath, substitutes at the bottom. Four questions, one screen, in the order a person asks them.

On the tool, because it matters

This was built in Axure RP, and the prototype behaves like the product — conditional logic, real data sets, state that persists as you move through it.

That is the point, not a footnote. A prototype that genuinely functions can be tested against scenarios: give someone a situation, watch what they do, see where they stall. You cannot do that with a clickable picture. Much of our testing on work like this ran against prototypes at this fidelity, which is how design defects got found before engineering wrote anything.

And it is still a live skill. Figma is where we work now, but regulated and enterprise environments still run on Axure, and plenty of teams have a decade of specifications sitting in it. Being able to read, extend and test in a legacy tool is worth more than pretending the industry moved on all at once.

Healthcare analyticsDecision support UXInteractive prototypingAxure RPScenario testingEnterprise module design
Conditional
logic and state, not linked screens
Testable
scenarios run against it like a real product
Still live
the prototype runs today, years on

What carries over

An older project, and the method behind it is the one we still use.

Design the decision

not the data

Ask what the person is trying to decide and in what order they ask the questions, then build the screen in that order. Most enterprise dashboards show what the database has rather than what the decision needs.

Find the work

happening off-system

The case history was not requested. It existed in phone calls and email because no tool held it. The highest-value feature in a workflow product is usually the one people are already doing by hand.

Prototype at a fidelity

you can actually test

If it cannot respond, you cannot run a scenario against it, and you are testing opinions instead of behaviour. The tool matters less than whether the thing behaves.